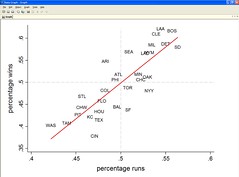
(percentage runs and percentage wins for mlb teams. the vertical distance from the regression line can be thought of as the extent to which a team is over/underachieving in terms of wins given its runs scored/runs against)
I made a toy graph this morning, firstly to celebrate the Yankees underachievement given that we are at the halfway point of the season, but secondly to try out Stata's new graphics.* It has changed the graphics menus all around to take advantage of its now allowing child dialogs, although in my opinion it ends up overusing them. If I had a choice between the Stata 10 and Stata 9 menus, I'd probably choose the Stata 9 menus, making this feel not exactly like an upgrade, but that could reflect more my familiarity with Stata 9. The big upgrade, anyway, is the Graphics Editor, but it ended up being not intuitive enough that it clear I would have to do more to figure it out than the simple playing I was hoping for. So the graph above doesn't even end up using it.
In a nutshell: The graphics editor was billed as the big reason for somebody who doesn't have reason to use the new statistical features of Stata 10 to upgrade. My first impression is that it's not enough. I've become pretty used to importing graphs into Illustrator or even just Office and editing them there anyway. I'll let you know if my opinion changes.
* My belief is that you cannot honestly be a liberal and root for the Yankees in any kind of serious way. I'm not kidding. At most you can be one of those untrustworthy liberals, the sort who espouses basic liberal values but then goes and cares more about the fate of pets than children in poverty.
6 comments:
Stata has many, many virtues, but on the graphics front R still rules, I think.
Oh, and what team is at the high end of that graph?
That's right. The over-achieving Red Sox. Bow down.
Seems like the Yankees are going to do even worse for the next couple of weeks, too.
What's the formula for the line?
And can you do a poisson of Yankee, Red, and Diamondback victory margins?
You've done a great service to the community at large with 1) your review of stata; 2) your graph of the current state of baseball; and 3) your accurate analysis of the implications of yankee-fandom.
How about a graph comparing staff ERA's to winning percentages?
I love the blog! Congratulations on the Northwestern job!
I never made the move from Stata 8, should I?
What happens if you graph Bill James' Pythagorean Theorem of Baseball (IIRC: Runs For^2 / ((Runs For^2) + (Runs Against^2)) )?
Allegedly, it more closely matches win/loss percentage in the long run than straight-up run percentage.
Post a Comment