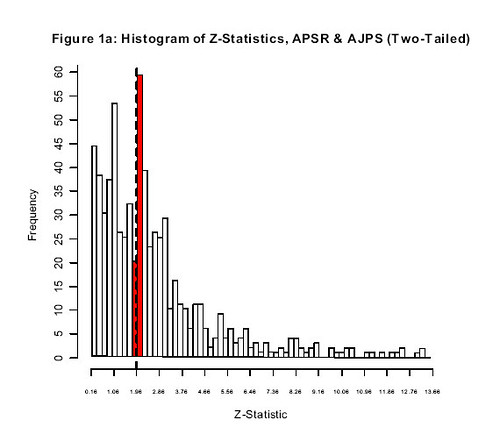
(graph from the Gerber and Malhotra paper. the expected shape of the graph in the absence of publication bias is like the right hand side of a bell curve)
Finally someone has written this paper. The graph is a histogram of the strength of results for a sample of articles on specific topics published in the two major journals of political science. See the dashed line? The dashed line corresponds to the p < .05 significance level that you need to be able to refer to your result as "statistically significant" and to be able to put a star by it. To the left of the line, no star; to the right of the line, star; this is the astrological base on which quantitative social science presently rests. The difference in height between the two bars is the difference between results that are just short of the significance-testing goal line and those that are just beyond it. The reason for the sharp difference in height is presumably the result of the tendency of journals toward favor positive results and the tendency for authors to favor analytic decisions that result-in-positive-results. The title of the paper is "Can Political Science Literatures Be Believed?", the drama of which I presume is intended to suggest to readers this is a very serious problem. In this assessment, I think the authors are correct.
Anyway, if anyone out there is (a) in sociology, (b) has time on their hands, and (c) thinks their career would benefit from a publication in a major sociological journal, one could assemble key coefficients from sociology studies (especially when the key coefficient is an interaction effect, which is a special class of perversities unto itself) and do exactly this analysis--perhaps along with its close cousin, known as a funnel plot--and probably score an AJS or ASR (and, at worst, something like Sociological Methodology). No original idea needed, although copping an attitude in the conclusion would probably be good. I can promise you that you will get results that lead to the same conclusion as this paper, and my suspicion is--especially regarding interaction effects--results will be stronger for sociology than for the political science literatures on which this paper focuses.
Postscript: The astrosociology site remains up and is here.
8 comments:
Two reactions...
1) it is hard to get too excited about this. Isn't it in the nature of statistical training that we are better schooled at making "significant" results interesting than we are null findings? "Publication bias" or cognitive bias?
2) What's your problem with interactions? This is a genuine question, really! Yes, they are regularly misinterpreted, but is there more that you have in mind?
"The reason for the sharp difference in height is presumably the result of the tendency of journals toward favor positive results and the tendency for authors to favor analytic decisions that result-in-positive-results."
I think there's also a strong tendency of researchers not to bother submitting (or even writing up) papers that have less significant results than p<.05. Of course they are right, since papers that depend on a p=.06 finding, for example, will likely not be published, or at least not publish too well. When the last time you poured time into writing a paper that centered around a "marginally significant" finding.
I can honestly say I have no idea what that graph is showing. No idea.
It's not that it's a surprising finding, when one thinks about it, but it is interesting to think about the implications of it. Lots of papers contain this thing called a "literature review," which often make statements about studies that consistently show something or about how a preponderance of studies that show something. So long as one recognizes those are systematically biased summaries, then, well.
My problem with interactions:
1. As you note, for the uncomplicated linear model, they are still commonly flat-out misinterpreted by sociologists.
2. For nonlinear models, as in logistic regression, interpretation is more complicated and is fundamentally ambiguous. Most sociologists evince no understanding of this and consider interaction effects for nonlinear models like they were doing linear models.
3. Most important for the point here, interaction effects are sort of the Wild West of Unreplicable Results for any enterprise that has enough studies of the same outcome so that you can make judgments about this. When they deride "subgroup analyses" in clinical trials, that's a swipe at the failure of interaction effects to replicate. The problem is that it is easy to muck around in a single dataset and find a significant interaction effect and convince oneself (and readers) that it is real. Interaction effects are also often weakly powered, which is why those that make it into the journal are often just over the .05 line.
Not only is astrosociology still alive, it's just as valid as sociology.
Is there any chance, heaven forbid, that researchers are, let's say, "massaging" their data in order to get it just across the astral threshhold?
It appears worse than just publication bias. There are an unusually high number of results that are just barely under a p of .05. This suggests that something like a third of the papers with results in the .02-.05 range were originally in the .06-.10 range but they massaged the standard errors, transformed the data, added or subtracted controls, or otherwise pushed the effect just across the finish line.
I'm quite pleased to see a blog that pays attention to statistical
and methodologic issues!
One factor that hasn't been discussed is the 'purpose' of the model that is being presented and the 'roles' that various independent variables may play in the model.
I work on medical/epidemiological rather than social science studies (although I started out as a sociology undergrad major and had a short lived stint as a sociology grad student) so my comments my not be as applicable to poitical science, sociology etc.
A common type of study in the epi literature would look as follows:
"Does exposure E increase the
risk of disease D?"
Now, all the comments about selection bias, massaging, transforming etc that would lead to a surplus of p-values just below 0.05 would apply to the evaluation of this exposure of main interest.
But such studies invariably consider a range of other factors especially those that previous papers have established as risk factors for disease D or possible confounders for the exposure-disease realtionship. However, it is also common to see a 'final model' which has been honed down to include the exposure of main interest plus some small to reasonable number of the other variables - and the selection of this subset is highly related to the observed p-values often with some 'fetish' type retention of those variables with p-values < 0.05 compared to those just above
Additionally, some papers do quite clearly have the following goal:
"Find a small-moderate set of
variables that are (significant)
predictors for outcome Y"
If by 'significant' the authors mean p<0.05 vs 'having an effect whose size is important' then such a study will only report p-values <0.05.
Post a Comment